
Why bank–insurance linkages matter more than ever?
The global financial system no longer operates in silos. Over the past two decades, a significant convergence has occurred: banks have expanded into insurance and asset management, while insurers have deepened their presence in capital markets through corporate bonds, private equity, derivatives, and structured products (Bernardi & Petrella, 2015; Foglia & Angelini, 2020; Allen & Jagtiani, 2000). As the distinction between “bank risk” and “insurance risk” becomes increasingly blurred, regulators and policymakers in Asia and beyond face a critical question.
When shocks hit the financial system, do these institutions absorb risk independently, or do they amplify each other’s stress?
Why averages can be misleading?
Most empirical measures of financial connectedness such as correlation or standard VAR-based spillover indices focus on mean relationships. These tools are useful, but they implicitly assume that risk transmission is linear and stable across time. However, financial markets are anything but linear. During tranquil periods, banks and insurers may appear loosely connected: diversification works, shocks are absorbed locally, and institutions retain a degree of independence. But during financial crises, global pandemics, geopolitical conflicts, or sharp monetary tightening, this insulation often disappears.
This blog argues that systemic risk between banks and insurers is fundamentally a tail phenomenon. By looking beyond averages and into the extremes of the return distribution, we uncover a striking pattern: connectedness between banks and insurers intensifies dramatically during periods of market stress and exuberance, while remaining fragmented in normal times.

What the data say: risk lives in the tails?
Using daily stock returns of the world’s top 10 banks and top 10 insurance companies from 2016 to 2025, we first examine the basic statistical properties of these returns. The evidence is striking. For instance, average returns are close to zero for both banks and insurers, while volatility is high and heterogeneous across institutions. Return distributions exhibit extreme kurtosis (fat tails), far exceeding the Gaussian (normal) benchmark, and skewness is generally close to zero suggesting no obvious dominance of upside or downside risk. In plain language, extreme events occur frequently on both the positive and negative sides of the return distribution, even if the overall distribution does not exhibit a strong skew in one direction.
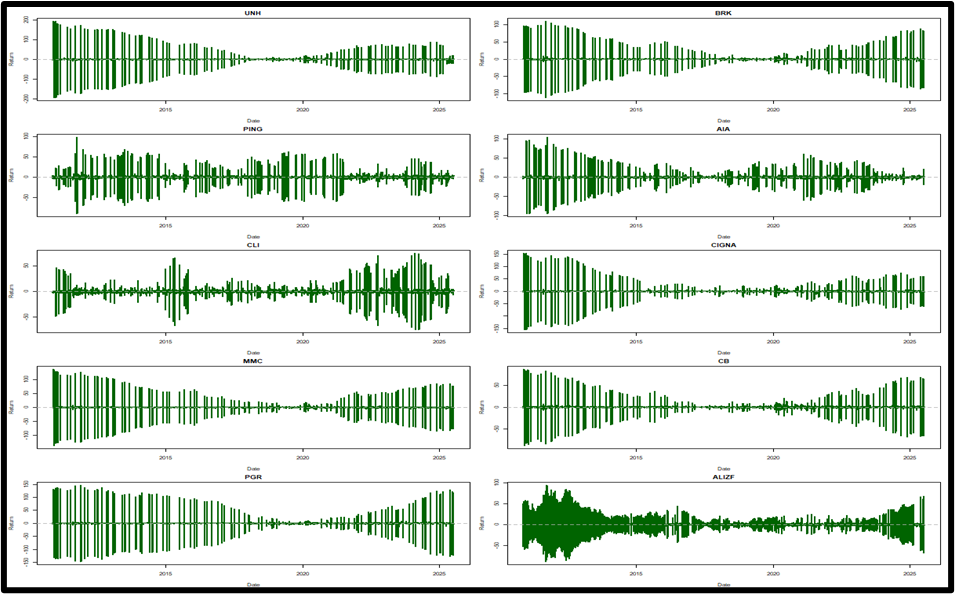
Visual inspection of the return series reinforces this message (Figure 1 and 2). Large spikes both positive and negative, appear in clusters during well-known stress episodes, such as the COVID-19 crisis and the Russia–Ukraine war. These spikes are not isolated outliers; they are a defining feature of the data, occurring in bunches rather than singly. The implication is clear: systemic risk cannot be understood by looking at averages alone.
A quantile perspective on connectedness
To capture this tail behaviour, we adopt a quantile-based connectedness framework. Instead of estimating spillovers at the mean, we examine how shocks propagate across institutions at different points of the return distribution. In particular, we focus on the lower tail (5th percentile) to represent periods of market stress and distress, the median (50th percentile) for normal market conditions, and the upper tail (95th percentile) to reflect periods of exuberance and risk-taking. This approach allows us to ask whether connectedness behaves differently when markets are calm versus when they are under pressure. The answer is an emphatic yes (Table 1).
Figure 1: Daily Bank Returns Illustrating Volatility Clustering and Extreme Movements
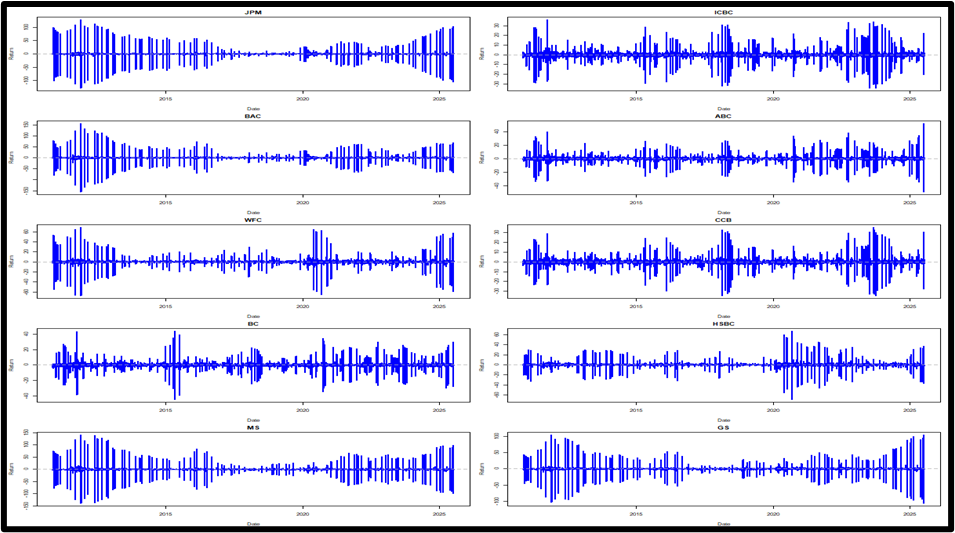
Figure 2: Daily Returns for Insurance Companies Illustrating Volatility Clustering and Extreme Movements
What happens to connectedness across market states?
In normal market conditions, total connectedness is moderate and directional, with commercial banks tending to receive shocks while investment banks (JPM, BAC, MS, GS) and large insurers act as transmitters (UNH, BRK, CIGNA, MMC, CB, PGR, ALIFZ). In this state, diversification offers protection, and risk transmission is selective rather than systemic.
Normal times: fragmented and directional: At the median quantile (normal market conditions), total connectedness between banks and insurers is relatively moderate. More importantly, directional patterns emerge commercial banks tend to be net receivers of shocks, while market-based institutions (including investment banks and large insurers) often act as net transmitters. In other words, spillovers have a clear direction and structure. In these conditions, diversification still offers some protection, and risk transmission remains selective rather than systemic.
Stress and exuberance: synchronized and overwhelming. In extreme market conditions, the picture changes dramatically: at both the lower and upper quantiles, the Total Connectedness Index (TCI) jumps to nearly 100%. In these states, institutions explain almost all of each other’s forecast error variance. As a result, “own” risk becomes negligible and any directionality collapses into system-wide synchronization. In simple terms, when markets enter extreme conditions, banks and insurers stop behaving as separate entities and instead move as a tightly coupled network. Notably, this result holds for both downturns and booms, indicating that exuberant markets can be just as systemically connected as distressed ones.
Asymmetry Across Market States, Not Just Shock Direction
A central insight from the analysis is that asymmetry in systemic risk arises not merely from the direction of shocks, negative (downside) versus positive (upside) but more fundamentally from the prevailing market state. Under normal conditions (median quantile), connectedness is lower and more heterogeneous, with no clear pattern in the roles of institutions, making it harder to distinguish consistent transmitters and receivers of shocks.
In contrast, in extreme market states whether triggered by financial distress (5th percentile) or exuberance (95th percentile), connectedness surges and becomes more synchronized. Notably, during distress, all banks become net receivers of shocks, while several insurers persistently transmit shocks, reflecting clearer systemic roles. This state-dependent asymmetry underscores that systemic risk is conditional and intensifies precisely when the system becomes most fragile.

Why banks and insurers amplify each other?
These findings help explain why bank–insurance linkages have become a central concern for regulators. Modern insurers are deeply exposed to financial markets through large investment portfolios, substantial corporate bond holdings, and extensive use of derivatives and reinsurance networks.
Similarly, banks have increasingly ventured beyond traditional lending, relying more on non-interest income and market-based activities. When asset prices move sharply, both sectors are affected simultaneously, creating feedback loops that amplify shocks. Our results suggest that such cross-sector spillovers are not a sideshow, they are a core channel of systemic risk, particularly under extreme market conditions.
Policy implications for central banks and supervisors
The implications for policymakers in SEACEN member countries and beyond are significant. Monitoring averages is not enough. Traditional indicators may underestimate systemic risk precisely when it is building up; tail-sensitive tools are essential for early warning systems. Stress tests should be asymmetric. Stress testing frameworks should explicitly account for nonlinear spillovers and state-dependent amplification, rather than assuming proportional responses.
Cross-sector coordination is critical. Banking and insurance supervision cannot remain siloed. During extreme market conditions, risks propagate seamlessly across sectors. Diversification benefits vanish in crises. Portfolio diversification across banks and insurers may appear effective in calm periods, but these benefits collapse when connectedness spikes in the tails.
Concluding thoughts
Asian financial systems are increasingly integrated into global capital markets. As banks and insurers in the region expand their operations across borders, the potential for cross-border and cross-sector contagion grows. Understanding when and how connectedness intensifies can help regional authorities design better macroprudential buffers, coordinate responses across regulatory agencies, and anticipate systemic vulnerabilities before they materialize.
The key message from this research is simple but powerful: systemic risk between banks and insurers is not constant. It emerges in the tails. By shifting our focus from averages to extremes, we gain a clearer picture of how financial shocks propagate and why crises feel so overwhelming when they occur. For policymakers, the lesson is equally clear: to safeguard financial stability, we must look where the risk actually lives, not at the center, but at the edges of the distribution.
Table 3: The Connectedness between Banks and Insurers
| OWN | FROM | TO | NET | OWN | FROM | TO | NET | OWN | FROM | TO | NET | |
| JPM | 4.97 | 95.03 | 92.94 | -2.1 | 13.21 | 86.79 | 102.9 | 16.16 | 5.1 | 94.9 | 94.54 | -0.36 |
| ICBC | 4.8 | 95.2 | 90.23 | -4.97 | 20.8 | 79.2 | 71.46 | -7.74 | 4.76 | 95.24 | 88.84 | -6.4 |
| BAC | 4.94 | 95.06 | 92.79 | -2.27 | 13.1 | 86.9 | 99.15 | 12.26 | 5.19 | 94.81 | 96.21 | 1.4 |
| ABC | 4.89 | 95.11 | 91.68 | -3.43 | 21.62 | 78.38 | 69.36 | -9.02 | 4.93 | 95.07 | 91.38 | -3.68 |
| WFC | 4.9 | 95.1 | 92.25 | -2.85 | 20.22 | 79.78 | 67.52 | -12.26 | 5.3 | 94.7 | 97.62 | 2.92 |
| CCB | 4.82 | 95.18 | 90.77 | -4.41 | 21.28 | 78.72 | 67.13 | -11.59 | 4.71 | 95.29 | 88.54 | -6.75 |
| BC | 4.9 | 95.1 | 91.77 | -3.33 | 21.45 | 78.55 | 70.21 | -8.33 | 5.02 | 94.98 | 92.94 | -2.05 |
| HSBC | 4.92 | 95.08 | 91.36 | -3.72 | 19.89 | 80.11 | 64.72 | -15.39 | 5.41 | 94.59 | 98.81 | 4.22 |
| MS | 5.02 | 94.98 | 94.22 | -0.76 | 12.48 | 87.52 | 101.2 | 13.69 | 5.08 | 94.92 | 94.82 | -0.09 |
| GS | 4.98 | 95.02 | 93.29 | -1.73 | 13.31 | 86.69 | 96.9 | 10.21 | 4.96 | 95.04 | 92.68 | -2.36 |
| UNH | 5.26 | 94.74 | 98.97 | 4.23 | 13.93 | 86.07 | 101.8 | 15.78 | 5.47 | 94.53 | 101.02 | 6.5 |
| BRK | 5.18 | 94.82 | 97.57 | 2.75 | 13.15 | 86.85 | 103.7 | 16.92 | 5.01 | 94.99 | 95.1 | 0.11 |
| PING | 5.06 | 94.94 | 93.8 | -1.15 | 30.05 | 69.95 | 56.01 | -13.94 | 5.1 | 94.9 | 95.13 | 0.23 |
| AIA | 5.24 | 94.76 | 97.35 | 2.59 | 29.18 | 70.82 | 58.61 | -12.21 | 5.26 | 94.74 | 98.15 | 3.4 |
| CLI | 5.04 | 94.96 | 95.17 | 0.21 | 26.69 | 73.31 | 56.75 | -16.56 | 5.11 | 94.89 | 95.87 | 0.98 |
| CIGNA | 5.09 | 94.91 | 96.03 | 1.12 | 14.34 | 85.66 | 95.45 | 9.79 | 4.91 | 95.09 | 92.69 | -2.4 |
| MMC | 5.53 | 94.47 | 104.1 | 9.68 | 12.19 | 87.81 | 108.4 | 20.61 | 5.33 | 94.67 | 100.08 | 5.4 |
| CB | 5.14 | 94.86 | 97.33 | 2.47 | 14.86 | 85.14 | 94.58 | 9.44 | 4.88 | 95.12 | 92.44 | -2.68 |
| PGR | 5.58 | 94.42 | 104.0 | 9.63 | 13.9 | 86.1 | 103.9 | 17.79 | 5.22 | 94.78 | 97.93 | 3.16 |
| ALIZF | 4.98 | 95.02 | 93.05 | -1.97 | 43.43 | 56.57 | 20.97 | -35.6 | 4.97 | 95.03 | 93.48 | -1.55 |
| TCI | 94.94 | 80.55 | 94.91 | |||||||||
REFERENCE:
1. Allen, L., & Jagtiani, J. (2000).
The risk effects of combining banking, securities, and insurance activities.
Journal of Economics and Business, 52(6), 485.
https://doi.org/10.1016/s0148-6195(00)00033-3.
2. Bernardi, M., Gayraud, G. and Petrella, L. (2015)
Bayesian Tail Risk Interdependence Using Quantile Regression.
Bayesian Analysis, 10, 553-603.
https://doi.org/10.1214/14-ba911
3. Foglia, Matteo & Angelini, Eliana, 2020.
“From me to you: Measuring connectedness between Eurozone financial institutions,”
Research in International Business and Finance, Elsevier, vol. 54(C).
https://doi.org/10.1016/j.ribaf.2020.101238