

There has never been any asset that has staged a series of four bubbles, crashed after
each of them, and after a while regrouped to stage another bubble, the way bitcoin has.
John Authors, Points of Return, 26 March 2021
Every aspiring baker knows only too well that getting a soufflé to rise can be a big challenge. As a soufflé bakes, hot air gets trapped inside, and as soon as it is removed from the oven, the air escapes, causing the soufflé to deflate. By contrast, the bitcoin soufflé has now risen at least four times (Figure 1). And just like an unfortunate soufflé, prices in previous bitcoin rallies, such as 2013, 2017 and 2021 (twice), surged quickly only to collapse just as dramatically.
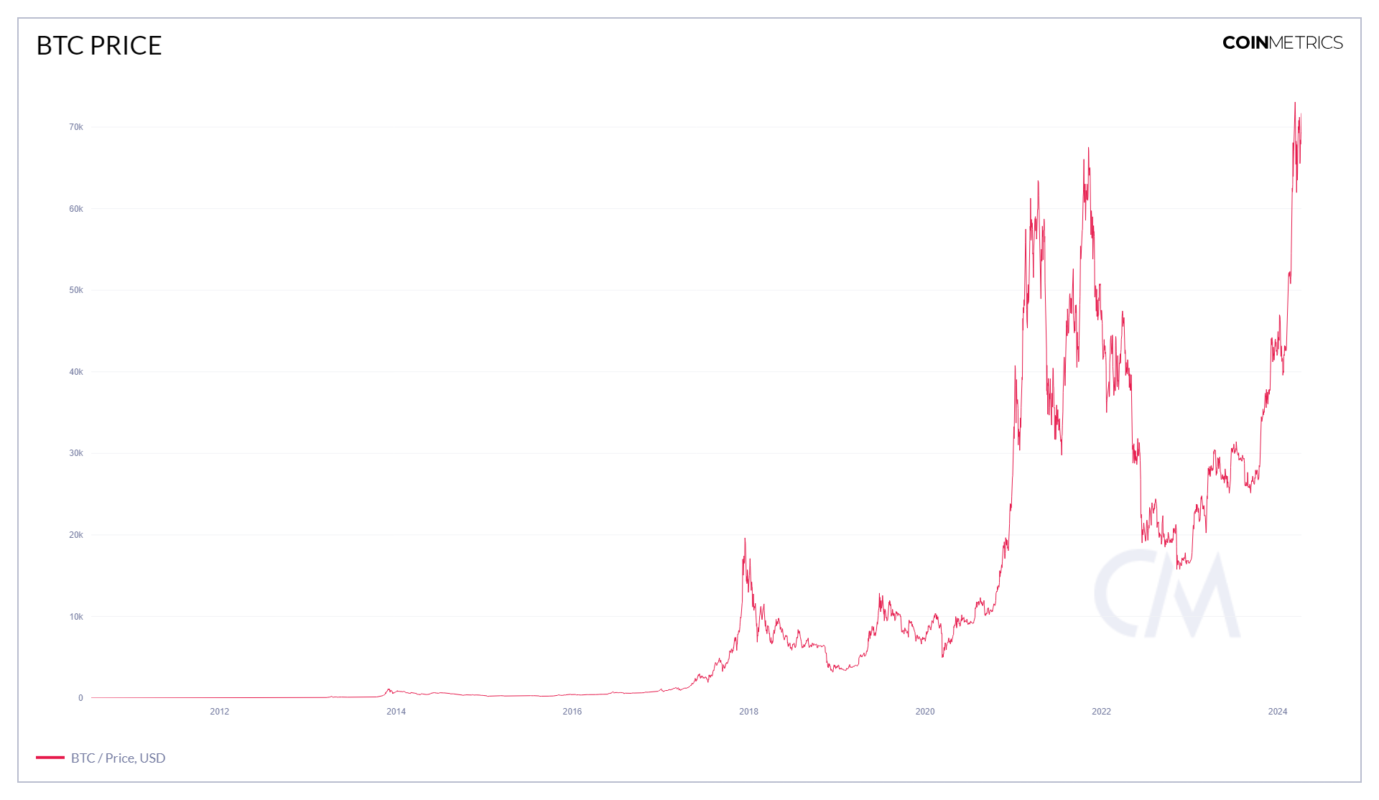
Source: CoinMetrics.
Figure 1
One explanation, put forward by crypto enthusiasts, is that bitcoin price rises reflect the fact that the market finally understands its true value, establishing the cryptocurrency as a bona fide new asset class with institutional interest. This line of argument about bitcoin’s respectability culminated in the US’ Securities and Exchange Commission’s (SEC) approval, albeit grudgingly and under legal duress, of spot bitcoin Exchange-Traded Funds (ETFs) on 10 January 2024. A lot of investment advice recommends a small bitcoin position (of one or two per cent) in a portfolio for diversification purposes. As such, bitcoin’s continuous rebounds in the face of strong headwinds reassure mainstream investors and traditional financial institutions alike about its resilience. But while bitcoin will undoubtedly continue to deflate and rise again, the explanation for its price behaviour has more to do with a particular alignment of structural and temporary or ‘cyclical’ factors that is less fanciful than the story put forward by the crypto enthusiasts and simply based on straightforward economic theory.
In terms of a recipe, the four essential ingredients required to make a perfect bitcoin soufflé on a regular basis are:
- a large portion of unusual design features and market structure;
- a teaspoonful of market manipulation;
- a dollop of non-traditional investor psychology and behaviour; and
- a generous sprinkling of information asymmetries in price discovery.
IIn short, bitcoin’s price moves are driven by the technical – or structural – mechanisms (the first ingredient) that create its scarcity, especially when they align or coincide with shorter-term recurring or cyclical factors (the remaining ingredients).
The design and economics of bitcoin…and some finance theory on bubbles
The economics of bitcoin is the economics of scarcity. Since the first bitcoin was mined on 3 January 2009, its total issuance was always going to be capped at 21 million according to its protocol. This number is expected to be reached around 2140. Figure 2 shows both the total supply of bitcoin (the red line) and what is known as the effective or adjusted supply (the green line). The former steadily increases towards its upper limit of 21 million, albeit at a decreasing rate of change. The latter adjusts the total supply of bitcoin that are irretrievably lost (because of discarded hard drives, say), inaccessible (because of lost wallets and forgotten passwords) or simply in the form of dormant accounts, particularly by long-term investors, called HODLers. In total, there is some evidence that up to 20 per cent of the theoretical supply of bitcoin has been irretrievably lost (Chainanalysis (2020)). This adjusted supply has been roughly unchanged since 2015.
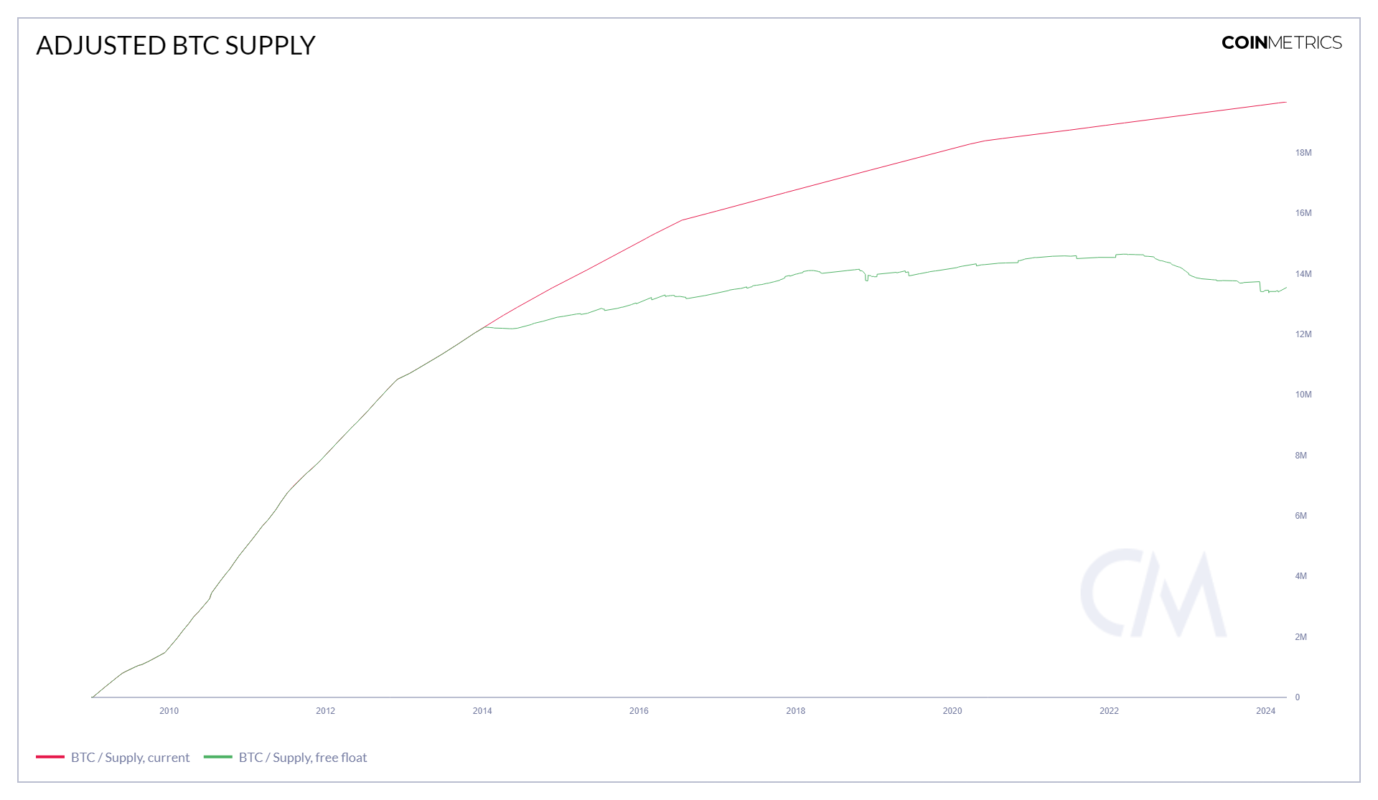
Source: CoinMetrics.
Figure 2
While precise estimates of the adjusted supply differ across data providers and their particular methodologies, the evidence for an unchanged effective supply of bitcoin since 2015 remains consistent.
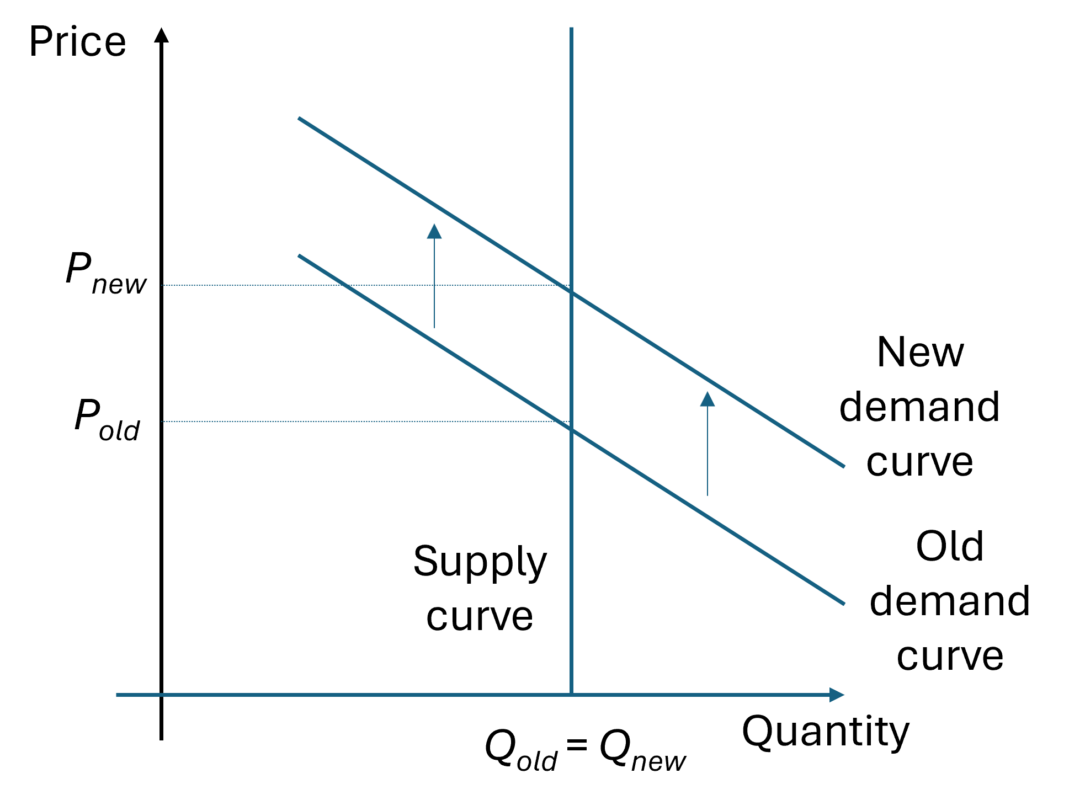
Figure 3
The upshot of the – more or less – unchanged adjusted or effective supply of bitcoin since 2015 translates into a vertical supply curve in a basic demand-supply diagram (Figure 3). When fixed – or inelastic – supply, denoted by quantity Q on the horizontal axis, meets rising demand, such that the demand curve moves up, prices, denoted by P on the vertical axis, must rise. This is Economics 101 and constitutes the first – and most important – structural explanation of bitcoin’s price behaviour over the past decade (Cochrane (2017), CME Group (2018)). We note that three of bitcoin’s peaks in Figure 1 have occurred in the period of horizontal effective supply: 2017, 2021 and 2023-2024. In addition, a fixed and limited supply drives up price volatility by encouraging hoarding and forces new buyers to outbid existing holders.1
This contrasts with exhaustible – or finite – natural resources such as oil and gold, which are also limited in supply. While the total quantity is fixed, the relevant upper supply limits can generally only be estimated and such estimates have trended upwards over time, and price movements in either direction do have an effect on supply. In the case of oil, say, alternative sources, such as shale and deep-see drilling, become viable when oil prices are high. Similarly, the discovery of new gold veins can unpredictably increase its supply. This is not the case with bitcoin, although investors can obviously move into alternative cryptocurrencies (altcoins) or, as of late, spot bitcoin ETFs.
The final piece of theory that is required concerns the existence of speculative price bubbles in asset markets. In this regard, finance theory has identified three components that are required for financial prices to inflate in the form of a bubble: a constant stream of new money, speculation and cheap money (Cochrane (2017)). These three factors are akin to fuel, heat and oxygen that are needed for a fire to burn. The burgeoning literature on whether or not (recurring) bubbles exist in bitcoin’s price dynamics are summarised in, inter alia, Geuder et al. (2019), Kyriazis et al. (2020) and Kayal and Rohilla (2021).
Those two aspects, a fixed adjusted supply underpinning the supply side of bitcoin (the vertical supply curve) as well as the bubble components driving the demand side for bitcoin (the upward movement in the demand curve), provide the theoretical foundations for explaining bitcoin’s price developments since 2015.
Repeating factors that align with structural factors
A number of periodically recurring factors, which may change over time, ensure that bitcoin benefits from (periodic) waves of new investment, thereby pushing up the demand curve as in Figure 3. The price of bitcoin therefore rises solely because a growing number of new investors puts money into it.
Some reasons given for the bitcoin rallies in 2021 and 2023-2024 include:
2021
- COVID-19 pandemic stimulus cheques – equivalent to the availability of new money;
- the rising accessibility of trading apps, leading to the gamification of trading (i.e., essentially commission-free trading apps); and
- general boredom during the COVID-19 lockdown, wonderfully encapsulated in Matt Levine’s 2021 “boredom markets hypothesis”, which states that people will buy stocks (or any asset of your choice) when buying stocks (or any asset of your choice) is more fun than other things they could be doing for fun.
2023-2024
- the initial anticipation, and later realisation, of regulatory approval of spot bitcoin ETF on 10 January – bringing new money into the market;
- the closures of the most high-profile cryptocurrency criminal cases, such as FTX and Binance, served as a cleansing moment that flushed out bad elements and strengthened the underlying infrastructure, thereby signalling an end to the ‘Wild West’ phase of the cryptocurrency industry; and
- the bitcoin halving expected in April 2024.
Probably the most important recurring feature is bitcoin’s regular halving. To enhance bitcoin’s scarcity and ensure the ultimate issuance of 21 million bitcoin, the bitcoin protocol involves a regular reduction in the reward miners are paid to verify the transactions that will be added to the blockchain. More precisely, the fees (as well as the rate of new issuance) are halved every 210,000 transactions (which equates to a period of roughly four years). At the next halving, expected to occur in late April 2024, the issuance of new bitcoin will decrease from 900 to 450 per day, directly affecting the supply side of bitcoin’s economy (Glassnode (2024)). In practice, this will reduce the supply of new bitcoins on the market, meaning that scarcity increases (when demand continues to rise).
By intentionally limiting the supply of new bitcoin, the shortage caused by the halving can affect the price of bitcoin and potentially spur a so-called bull run, i.e., a period in which the price of bitcoin rises significantly. Historically, not only have bitcoin prices risen in the lead-up to the halvings in 2012, 2016 and 2020, but most of bitcoin’s gains came directly after a halving event. There have been three bull runs associated with halving events, each lasting 12 to 18 months after the halving:
- following the 29 November 2012 halving, bitcoin prices were up by 7,745 per cent a year later;
- following the 9 July 2016 halving, bitcoin prices were up by 460 per cent a year later; and
- following the 11 May 2020 halving, bitcoin prices were up by 670 per cent a year later.
Price discovery and market efficiency
For potential investors, some pertinent pieces of information to have prior to buying an asset revolve around its price and who the other asset holders are. As such, the price should be fair and the market transparent.
Despite many valiant attempts, it has proven impossible to assign a fundamental, fair or equilibrium asset value to bitcoin. This is because bitcoin is not an asset in the traditional sense: it generates neither cash flows derived from economic returns on capital (like real estate) nor claims on future cash flows (like dividends in the case of equity) and is disjointed from economic or productive uses (like commodities) or social benefits (like gold).
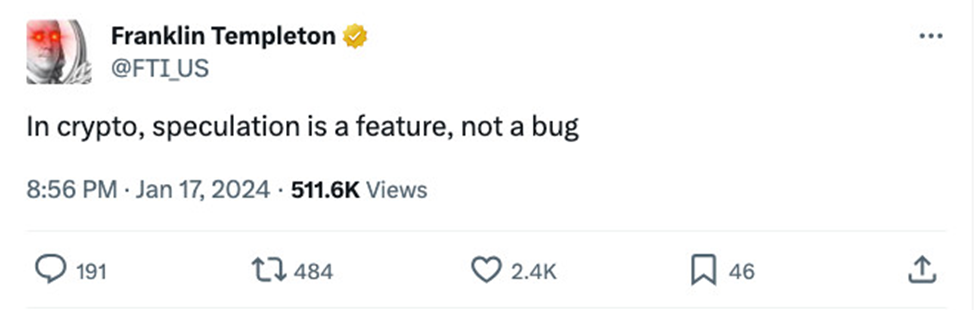
In contrast to earlier periods of bitcoin use, which were dominated by miners (2009 to 2012) and early commercial adopters (2012 to 2013), the period since 2014 has been dominated by cryptocurrency exchanges and financial speculation (Tasca et al. (2018)). The market valuation of bitcoin is therefore based on speculation, as US asset manager Franklin Templeton reminded us this year.
In the words of the FT’s Editorial Board (6 December 2023)), “What bitcoin ultimately offers is a chance to speculate on the market’s sentiment towards itself”, meaning that its price is particularly susceptible to changes in sentiment. For that reason, the investment case for crypto assets in general, and bitcoin in particular, rests on finding a convincing narrative to continuously draw in new money.
Thankfully, bitcoin offers an investment strategy for all seasons – the bitcoin story provides a flexible narrative fit for any scenario and all regimes, which results in a recurrence of waves of new investors, driving up the demand curve in Figure 3 on a repeating basis:
So when yields are falling because interest rates are coming down, they’re like, see, buy bitcoin. But when yields are rising because inflation’s really high, then they say, see, buy bitcoin because it’s an inflation hedge. And so you end up with these really funny circular arguments where it’s like, you know, geopolitical risk is higher − buy bitcoin. It’s lower − buy bitcoin. Yields are higher − buy bitcoin. Whatever the question is, the answer is for these people, buy bitcoin (Katie Martin in the FT Unhedged podcast of 7 December 2023).
Along similar lines, Garcia et al. (2014) identified two positive feedback loops that lead to price bubbles in the absence of exogenous stimuli: one driven by word of mouth, and the other by new bitcoin adopters. In terms of investor psychology, there is less emphasis on doing ‘fundamental’ analysis and more reliance on non-traditional sources of information in financial markets. One implication of such investor behaviour is herding, i.e., investors simply – and naïvely – imitate the actions of other investors without adequate information and appreciation of the risk-reward trade-offs. In a Cardify survey of 8 October 2021, almost 60 per cent of respondents turned to high-profile individuals, such as VIPs, celebrities or executives, for information on cryptocurrencies more than half the time. In the current environment, investors easily believe unnamed sources and unverified reports and buy on rumours.
Market participants are mainly focused on anticipating what other market participants would consider the market price to be. If, for some reason, market participants come to believe that other market participants would expect prices to rise, the market price will rise irrespective of any changes in intrinsic value. In addition, there is a self-fulfilling prophecy at work: bitcoin’s gains are down to the anticipation of more gains.
For that reason, the bitcoin market often rewards long-term holders who exercise patience and punishes more inexperienced market participants (the ‘greater fool’) as well as those falling prey to the fear of missing out (FOMO) and entering the market late as prices increase.
Bitcoin market concentration and manipulation
How can aforementioned bitcoin dynamics happen in an efficient market, i.e., one where asset prices reflect all available information? For example, price rises before halvings should not occur as they are hard-coded into the bitcoin protocol, such that the effects of the halvings should have been incorporated into the price since the (approximate) timing of the halving and its effect on bitcoin supply every four years have been known from the start of bitcoin in 2009.
The reality of the crypto market is one of widespread price manipulation and an absence of market transparency. Most bitcoin trading occurs on lightly regulated or unregulated cryptocurrency exchanges. Quoted screen prices tend to be composites from inputs supplied by multiple exchanges, but price manipulation on these exchanges is well documented. Just to pick one representative study, a Forbes analysis of 157 crypto exchanges in 2022 found that 51 per cent of the daily bitcoin trading volume being reported was likely “fake or non-economic”.
Two sorts of market manipulation are prevalent: many deals involve transfers between clients within a single wallet of an exchange, while other traders can engage in “wash trading”. The latter, which has been estimated to account for as much as 90 per cent of bitcoin trading volume, is “…a practice whereby traders seek to increase the appearance of high trading interest by both selling and buying the same products at the same time, often driving up prices, and then selling to unwitting third party market participants at inflated values (Crenshaw (2024))”. The former involves moving around existing assets in a closed loop, which largely benefits a handful of so-called bitcoin whales, where the name refers to the size of their holdings compared to other market participants.
The crypto ecosystem is marked by a high degree of concentration and wealth disparity: a – representative – report by Glassnode (2021) found that two per cent of ‘network entities’ (excluding miners and crypto exchanges) controlled 71.5 per cent of all bitcoin (and 0.01 per cent controlled almost 60 per cent of bitcoin’s supply). By selling assets to themselves using different wallets, bitcoin whales have the ability to impact the price of bitcoin with malicious trading activity. The result is once again the impression that prices are higher and liquidity more plentiful than is actually the case. As a result, big bitcoin investors have the strongest incentive to keep the euphoria going, while those who got in early or hold a large stake have a huge financial incentive to draw in others by any means necessary.
By tracking the cyclical nature of long- and short-term holder supply, Glassnode (2021) identified a shift towards longer-term holding of bitcoin as a long-term investment, further tightening liquidity in the market, making price changes even more responsive to temporary demand shifts (Figure 4).
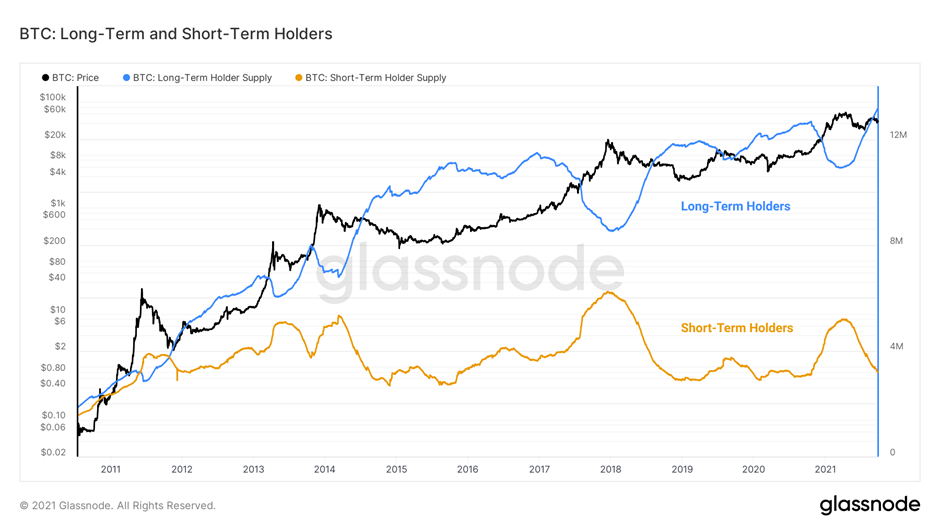
Source: Glassnode Insight (2021).
Figure 4
Figure 4 illustrates how the interplay between short- and long-term holders reduces the active supply of bitcoin on the market. As the bitcoin price the breaks the previous high (a bull run), long-term holders (the blue line) begin net selling and rotate out of their positions. Once the market bull run breaks down, long-term holders finish spending and resume net accumulation again. In so doing, they capture a greater portion of relative supply with each cycle in a stepwise manner. While many bitcoins are spent into rallies and transferred to new investors, a more significant percentage remains dormant and further adds to the balance of long-term holders when they resume accumulation on the other side of the run.
Conclusion
The bitcoin market is highly illiquid, thinly traded, very badly structured and insiders disclose neither their holdings nor their trades. Add to this widespread price manipulation and neither bitcoin price nor quantity information can be trusted. This not only makes price discovery of an equilibrium or fair price almost impossible, but it renders any price discovery on the basis of bitcoin ‘fundamentals’ illusory. The absence of any fundamental value makes the bitcoin price particularly sensitive to changes in risk appetite and market narratives (Panetta (2023), Shiller (2020)).
Rallies are driven by alignments of structural with temporary factors that collectively contribute to bitcoin’s frequent bull runs. Bitcoin’s supply tightness results in fund flows into the bitcoin market having an outsized effect on prices. Even a small reallocation in individual retail investors’ portfolios can make for large flows into bitcoin in aggregate – thus once again providing a flow of new money.
There are a number of reasons why the current high price of bitcoin is likely to deflate like the unfortunate baker’s soufflé:
- The sizeable bitcoin holdings tied up in the bankruptcy proceedings of FTX and Three Arrows Capital will eventually be released by the liquidators, increasing supply and shifting the supply curve in Figure 3 to the right.
- After the initial price increase following the three earlier halvings, prices have fallen substantially thereafter:
- following the 29 November 2012 halving, bitcoin prices were up by 7,745 per cent a year later;
- following the 9 July 2016 halving, bitcoin prices were up by 460 per cent a year later; and
- following the 11 May 2020 halving, bitcoin prices were up by 670 per cent a year later.
- While previous bitcoin troubles may be over and forgotten, future eggshells await. The approval of spot bitcoin ETFs has spawned proposals for leveraged spot bitcoin ETF products and other financial innovation, such as option-based spot bitcoin ETFs. Any extra leverage in the ETFs would not only exacerbate the swings already experienced by the volatile bitcoin price, but also expose market participants to margin calls and forced selling in response to price declines.
- Bitcoin’s surge so far in 2024 has taken the bitcoin spot price far above the price to generate a bitcoin (which can be regarded as some form of theoretical lower floor for prices, mainly in the form of the electricity required by computers to mine bitcoin). With the upcoming halving, some crypto miners will become non-profitable and shut down as a result, particularly those with higher energy costs, while the most profitable miners with lower energy costs will remain. Even so, halving the reward miners get is going to make things harder for miners to operate. Some miners already accept (optional) transaction fees, paid by users to ensure their deal is checked first. Higher bitcoin transaction fees may decrease the demand for bitcoin and therefore future prices.
- New platforms to trade bitcoin are not likely to be a panacea. The simple existence of the spot bitcoin ETF product does not change the underlying absence of a use case for bitcoin. While it changes or increases demand and brings in new money, spot bitcoin ETFs mainly redistribute the capital that traders have already invested in the cryptocurrency industry, rather than attracting new investment. At the end of the day, a spot bitcoin ETF is simply a new way of drawing money into the asset class in order to speculate on the price of bitcoin. Moreover, the new products do not solve any of the fundamental crypto problems, such as volatility, manipulation and fraud.
It is still the case that the demand for bitcoin goes up when the price goes up and vice versa, which is typical for the sort of speculative hype that involve simple heuristics such as trend extrapolation. Speculation and the fear of missing out (FOMO) have always played a part in bitcoin trading, and there is little evidence that this is changing. Bitcoin’s recurrent rallies are driven by the cyclical factor of a constant stream of bullish narratives reinforcing the structural backdrop of fixed supply, thereby driving the price higher. This underscores the basic fact that bitcoin needs investors more than investors need bitcoin.
- In theory, corporate equity supply curves should also be vertical, although direct empirical assessment of elasticity finds sizeable deviations from perfect elasticity (Bagwell (1991)). ↩︎
Ole is the Director of the Macroeconomic and Monetary Policy Management Pillar at The SEACEN Centre.