

Capital flows and their volatility present challenges for economic policy makers. They can exacerbate economic cycles. Their outflows can lead to costly “sudden stops”. One particular form of capital flows, namely foreign direct investment (FDI) has been regarded differently compared to other forms of capital flows like debt and portfolio flows. First, unlike foreign portfolio investment, FDI is a long-term commitment. Second, FDI has been found to flow into a country to finance its productive investment opportunities and help the receiving country to grow. Moreover, FDI is more than just a capital investment; it can also include the provision and transfer of technology or management.
Official statistics suggests that Luxembourg, a country of 600,000 people, hosts $4 trillion in FDI ($6.6 million per capita), which is as much FDI as the United States and much more than China. Does Luxembourg really attract FDI of this size? If so, what does that imply for its stock of physical capital or investment share of output? It should not come as a surprise that the “brick-and-mortar” investment is a tiny part of Luxembourg’s economy. Therefore, something is missing. “So is something amiss with official statistics or is something else at play?” At the same time, capital flows between countries can flow through financial centres before they arrive at their ultimate destination. Two recent papers seek to provide a more accurate picture of the true sources of foreign finance. This blog summarises these two key papers: Damgaard, Elkjaer, and Johannesen (2019), and Coppola, Maggiori, Neiman and Schreger (2020)
FDI is often an important driver for international economic integration that stimulates growth and creates jobs. Through the transfer of capital, human capital and technology FDI boosts productivity. Because of these benefits, many countries have designed policies to attract more FDI. But not all FDI brings capital in service of productivity gains. In practice, FDI is defined as cross-border financial investments between firms belonging to the same multinational group, and much of it is phantom in nature – investments that pass through empty corporate shells. These shells, also called special purpose entities, have no real link to the economic activity in the host economy. What they are doing is rather to carry out holding activities, conduct intra-firm financing or manage intangible assets – often to minimise the global tax bill of these multinationals. As a result, the traditional FDI statistics lose their informational value.
The bottom line is that better data are needed to understand why, where, by whom and why $40 trillion in FDI is being channelled around the world. By using a number of different data sources, Damgaard, Elkjaer, and Johannesen (2019) recently created a global network that maps all bilateral investment links with the aim of disentangling what they call “phantom FDI” from genuine “brick and mortar” FDI. As one could guess, a small number of well-known “tax havens” host the vast majority of the world’s phantom FDI. Luxembourg and the Netherlands host nearly half. With the addition of Hong Kong SAR, the British Virgin Islands, Bermuda, Singapore, the Cayman Islands, Switzerland, Ireland and Mauritius, ten economies host more than 85 percent of all phantom investments.
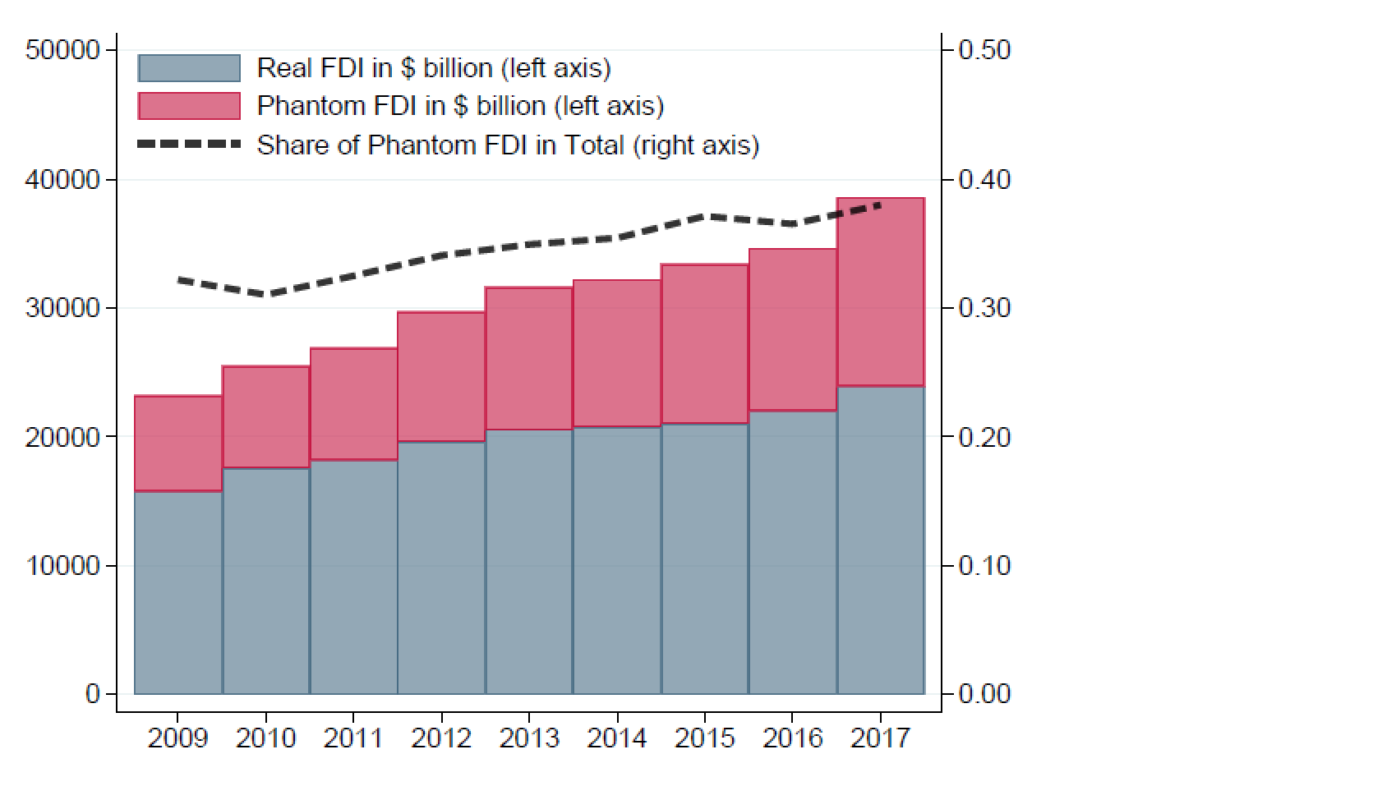
Source: Damgaard, Elkjaer and Johannesen (2019), page 37.
The figure above shows that within less than a decade, phantom FDI has climbed from about 30 per cent to almost 40 per cent of global FDI. This would have raised no eyebrows if the other types of capital flows had a similar pattern. But this growth is unique to FDI. Lane and Milesi-Ferretti (2018) showed that only FDI positions have grown faster than world GDP since the Global Financial Crisis. Other cross-border flows such as portfolio instruments and other investments have not.
Is phantom FDI an issue for tax haven countries only? The answer is no. While phantom FDI is largely hosted by a few tax havens, virtually all economies are exposed to the phenomenon. For example, most economies invest heavily in empty corporate shells abroad and receive substantial investments from such entities, with averages across all income groups exceeding 25 per cent of total FDI. Investments in foreign empty shells could indicate that domestically controlled multinationals engage in tax avoidance.
Similarly, investments received from foreign empty shells suggest that foreign controlled multinationals try to avoid paying taxes in the host economy. The authors also found evidence of what they call “round tripping,” i.e., supposedly inward foreign investment that is actually held by domestic investors. In the case of China and Russia, about 25 per cent of real FDI is owned by investors in those countries.
Another investigation of the data on international capital was undertaken by Coppola, Maggiori, Neiman and Schreger (2020). Their results, paper and data can be found on their website designed specifically for their analysis. The authors seek to uncover the ultimate issuers of securities issued by global firms through affiliates in tax haven. They distinguish between data reported on a “residency” basis based on the country where the securities are issued versus a “nationality” basis, which shows the country of the ultimate parent.
Similar to the previous paper, these authors also use data from several databases. These allow the authors to uncover global ownership structures or chains of securities through tax havens such as the Cayman Islands. Then, they use this mapping to determine the ultimate issuers of securities held by mutual funds and exchange traded fund shares that are reported by Morningstar, a global financial services firm. Finally, they use their reallocation matrices to transform residency-based holdings of securities as reported in the US Treasury’s International Capital (TIC) data and the IMF’s Coordinated Portfolio Investment Survey to nationality-basis holdings.

Their results lead to a number of important findings. Investments from advanced economies to emerging market countries, for example, have been much larger than has been reported. For example, US holdings of corporate bonds in the BRIC economies (Brazil, Russia, India and China) total $99 billion, much larger than the $17 billion that appears in the conventional data. US holdings of Chinese corporate bonds alone rise from $3 billion to $37 billion, and of Brazilian bonds the total increases from $8 billion to $44 billion. Moreover, these figures are even higher when the US subsidiaries of corporations in emerging markets which issue securities in the US are accounted for. Similarly, holdings of common equities in the emerging markets by investors in the US and Europe are much larger when the holdings are reallocated from the tax havens to the ultimate owners. This is particularly evident in the case of China.
The reallocation also shows that the amount of corporate bonds issued by firms in emerging markets has been more significant than realised. While the issuance of sovereign bonds is accurately reported, the issuance of corporate bonds has often occurred via offshore subsidiaries. These bonds are often denominated in foreign currencies, so their reallocation to their ultimate issuers results in an increase in foreign currency exposure for their home countries.
Similar to the first paper, this paper also finds that some “foreign” investment represents domestic investment routed through a tax haven. These flows are particularly significant in the case of the US. In addition, some FDI flows to China should be classified as portfolio flows, since they reflect foreign participation in offshore affiliates that is channelled to China. FDI positions are not revalued as often as portfolio holdings, and as a result the authors claim that China’s net foreign asset position is overstated.
These two papers and their results are arguably ground-breaking. They have first-order implications. We learn that the international ownership of capital is significantly more concentrated than previously thought. The US and some other developed economies have larger stakes in emerging markets that we thought. We also learn that some emerging markets are more vulnerable to “exchange rate shocks” or to currency depreciations than the official data suggest because their corporations have issued debt through subsidiaries in tax-haven countries. Finally, we also learn that multinational corporations have been successful in hiding their income from taxation by using tax havens. I would like to conclude with a quote from the brilliant Alan Krueger who left us exactly a year ago: “Sometimes it is better to collect new data than applying new techniques to the existing data”. These two papers do that and much more.